
 MATH225 Week 8 Assignment Performing Linear Regressions with Technology -Answers")
Question 1
The table below shows primary school enrollment for a certain country. Here, x represents the number of years after 1820, and y represents the enrollment percentage. Use Excel to find the best fit linear regression equation. Round the slope and intercept to two decimal places.
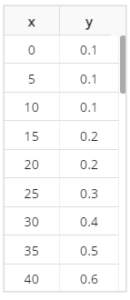
Ans: yˆ=0.52x−22.18.
Question 2
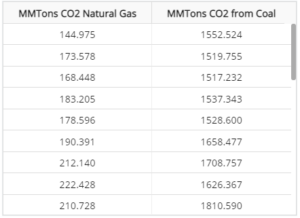
An energy economist studying the growth and decay of both the coal and natural gas industries wanted to leverage data collected by environmental scientists. Particularly, the economist wanted to study the link between the total yearly carbon emissions from both energy sources. They looked at 30 years of total yearly carbon emissions for a particular nation (measured in million metric tons of carbon dioxide) for both forms of energy. The data is provided below. Use Excel to calculate the correlation coefficient r between the two data sets. Round your answer to two decimal places.
Solution
…Kindly click on the purchase icon to get the full solution at $10